Operation
FISSURE is meant for people of all skill levels. Students or beginners can navigate through lessons and tutorials on how to interact with various wireless technologies. The User Dashboard offers friendly visual aids that demonstrate the RF device assessment process from start to finish. Beginners can also evade the hurdle that is traditionally associated with installing open-source tools - as the installer consists of a list of checkboxes for installing programs and dependencies. Meanwhile developers, educators, and researchers can use the framework for their daily tasks or to expose their cutting-edge solutions to a wider audience. Future development will draw heavily from feedback and interaction with the open-source community.
Start-Up Procedures
Open a terminal and enter fissure
Attach hardware and assign to components using the sensor node buttons (see below)
Launch a local sensor node or connect to a remote sensor node
Click the “Start” button to kick off automation and access remaining tabs
Click the “Start” buttons for individual components such as TSI or PD to start specific operations
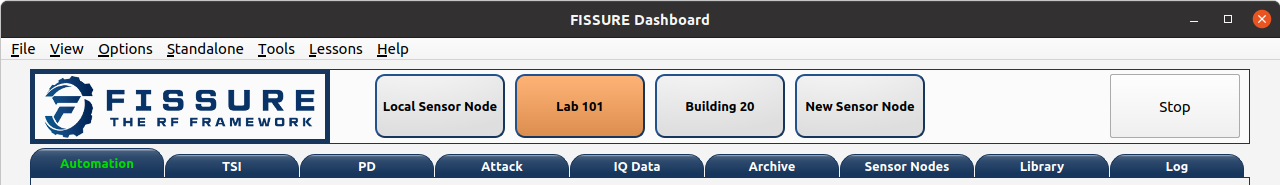
Sensor Node Buttons
The sensor node buttons at the top of the Dashboard are used for configuring one local sensor or multiple remote sensor nodes. To start, click the “New Sensor Node” button to view the sensor node configuration window. Following configuration, the sensor node button will display the nickname of the sensor node. Repeat the same steps to connect up to five sensor nodes. Use the sensor node configuration window to delete a sensor node. Right-click a sensor node button to select an active sensor node. Selection is necessary to dictate where messages originating from the Dashboard will go to, to display the available hardware options throughout the Dashboard, and to update the information in statusbar at the bottom of the Dashboard.
Sensor Node Configuration Window
The Sensor Node Configuration window is opened after clicking on a sensor node button. The window will display the settings of an existing sensor node or allow the user to configure a new sensor node. The “Sensor Node Topology” section provides the option to choose local or remote as well as enter nicknames, locations, and notes for a sensor node. A local sensor node will run sensor_node.py on the same computer as the Dashboard. The remote option requires the IP address, DEALER port, and PUB port of the remote sensor node in order to connect. The “Ping” button will ping the IP address in the terminal to determine if the sensor node address is reachable. The connect button will establish the HIPRFISR connections to the remote sensor node. If the “Recall Settings on Connect” checkbox is checked, the saved settings from the sensor node configuration file will populate items in the Sensor Node Configuration window. The fields and tables in the window are used by the Dashboard to pull information for a sensor node and keep track of network connections.

The “Mass Hardware Scan” window allows the user to select multiple radio types that are assumed to be connected to the sensor node computer. The “Autoscan” button will perform localized hardware scans for each type selected and return the results in the “Scan Results” section. Table rows that do not contain hardware details indicate scans that were unsuccessful. The “Manual Entry” button will forgo the localized scan and add a new row to the “Scan Results” table. Once a row is created, the user can manually type in hardware details or use the “Probe” or “Guess” buttons to help populate relevant columns in the table.
Each row in the “Scan Results” table can be added to the “Default Hardware Assignments” table. This table is what is used to save the sensor node hardware information and limit what can be accessed in each tab/component in FISSURE. Individual hardware selection for any FISSURE operation is done using comboboxes throughout the Dashboard.
The “Import” and “Export” buttons will translate the sensor node configuration information to/from a YAML file. The “Apply” will save the sensor node information. The “Delete” button will disconnect and remove a sensor node that has already been saved. Be sure to disconnect from a sensor node that has not had its settings saved with the “Apply” button prior to clicking the “Cancel” button.
Automation Tab
Select Automation Mode
Manual
User confirms all phases and can edit parameters
Discovery (Disabled)
Mostly automated, system chooses which signals to target and process
Target (Disabled)
User-defined specifications, only pursue targets fitting certain criteria
Select target protocol
Configure SOI auto-select criteria (optional)
Lock search band (optional)
Check RF hardware connections
Click Start
Custom (Disabled)
User creates any combination of settings
TSI Tab
Detector/Sweep
Click Start
Add search bands to table
Adjust Advanced Settings
Click Update TSI Configuration
Blacklist frequency ranges
View detected signals
Search signals by frequency in library
Conditioner (Future)
Tune, filter, separate, record, isolate
Feature Extractor (Future)
Select AI/ML technique, acquire feature set
Classifier (Future)
Choose AI/ML models, classify protocols/emitters, compare results
PD Tab
Status
Start Protocol Discovery (PD)
Demodulation
Search library for flow graphs
Start demodulation flow graph
Bit Slicing
Search for preambles
Slice buffer by preamble
Determine field delineations
Data Viewer
Enter binary or hex data, perform binary operations
Fill Protocol Matching table, apply against protocols in library
Manually send hex data to PD buffer for analysis
Dissectors
Create Lua sissectors for new packet types
Follow lesson on Lua dissectors
Click Update Wireshark to copy all FISSURE dissectors to Wireshark folder
Sniffer
Start demodulation flow graph with sniffer sink
Launch sniffer flow graph created for packet type
Manually send data to sniffer port
CRC Calculator
Enter hex, select configuration, calculate CRC
Enter two messages with known CRCs, find polynomial
Attack Tab
Single-Stage
Select protocol, modulation type, hardware combination
Double-click attack in tree widget
Configure attack variables
Start Attack
Apply changes while running flow graphs
Multi-Stage
Double-click attack in tree widget or click Add button
Adjust durations and reorder attacks
Click Generate
Adjust variables, Save, Load, select Repeat
Click Start
Fuzzing (Fields)
Choose fuzzing Fields attack (if available)
Choose protocol subcategory
Check fields, select type, enter limits
Start Attack
Fuzzing (Variables)
Choose fuzzing Variables attack
Load flow graph
Select variable
Start Attack
History
View attack history, delete rows
Packet Crafter
Packet Editor
Select protocol and packet type
Edit field values
Calculate CRC (when applicable)
Assemble message
Construct packet sequence
Save sequence to file
Scapy
Put wireless interface in monitor mode
Select 802.11x and packet type
Edit field values
Click Load Data
Click Refresh, enter interval, choose interface
Click Start
IQ Data Tab
Record
Assign device to IQ hardware button
Adjust settings in reference to applicable GNU Radio sinks
Record signals to IQ file(s)
Playback
Configure settings or copy Record settings
Click Play
Inspection
Double-click flow graph or click Load, Start
Adjust variables in GUI
Crop
Double-click IQ file in Viewer
Enter name for cropped IQ file
Adjust Start/End samples in Viewer
Click Crop
Convert
Choose input file, name output file
Select file types
Click Convert
Append
Choose/enter file 1, file 2, output file
Check Null to append samples to the front or end
Click Append
Transfer
Copy folders or files to new locations
Timeslot
Makes copies of a message at regular intervals
Choose input file with zeros before and after signal
Adjust sample rate, period, and number of copies
Click Pad Data
Overlap
Plot data, store data, shift data, add data together
Resample
Select input file, specify output file, choose rates, resample
OFDM
Experimental
Normalize
Select input file, speciy output file, choose min/max, normalize
Viewer
Choose data folder
Double-click/Load File to read data
Plot All, plot range, click End to detect last sample
Use toolbar to zoom, pan, save
Click Cursor, select two points on plot, Get Range
Use functions and analysis buttons
Click gear icon to adjust options
Archive Tab
Download
Select row in Online Archive table
Click Download
Plot or delete
Replay
Double-click downloaded file or press Add button
Build and configure playlist
Check Repeat, click Start
Sensor Nodes Tab
The Dashboard Sensor Nodes tab contains operations for the active sensor node (right-click). These operations include building autorun playlists and file navigation for computers running the sensor nodes.
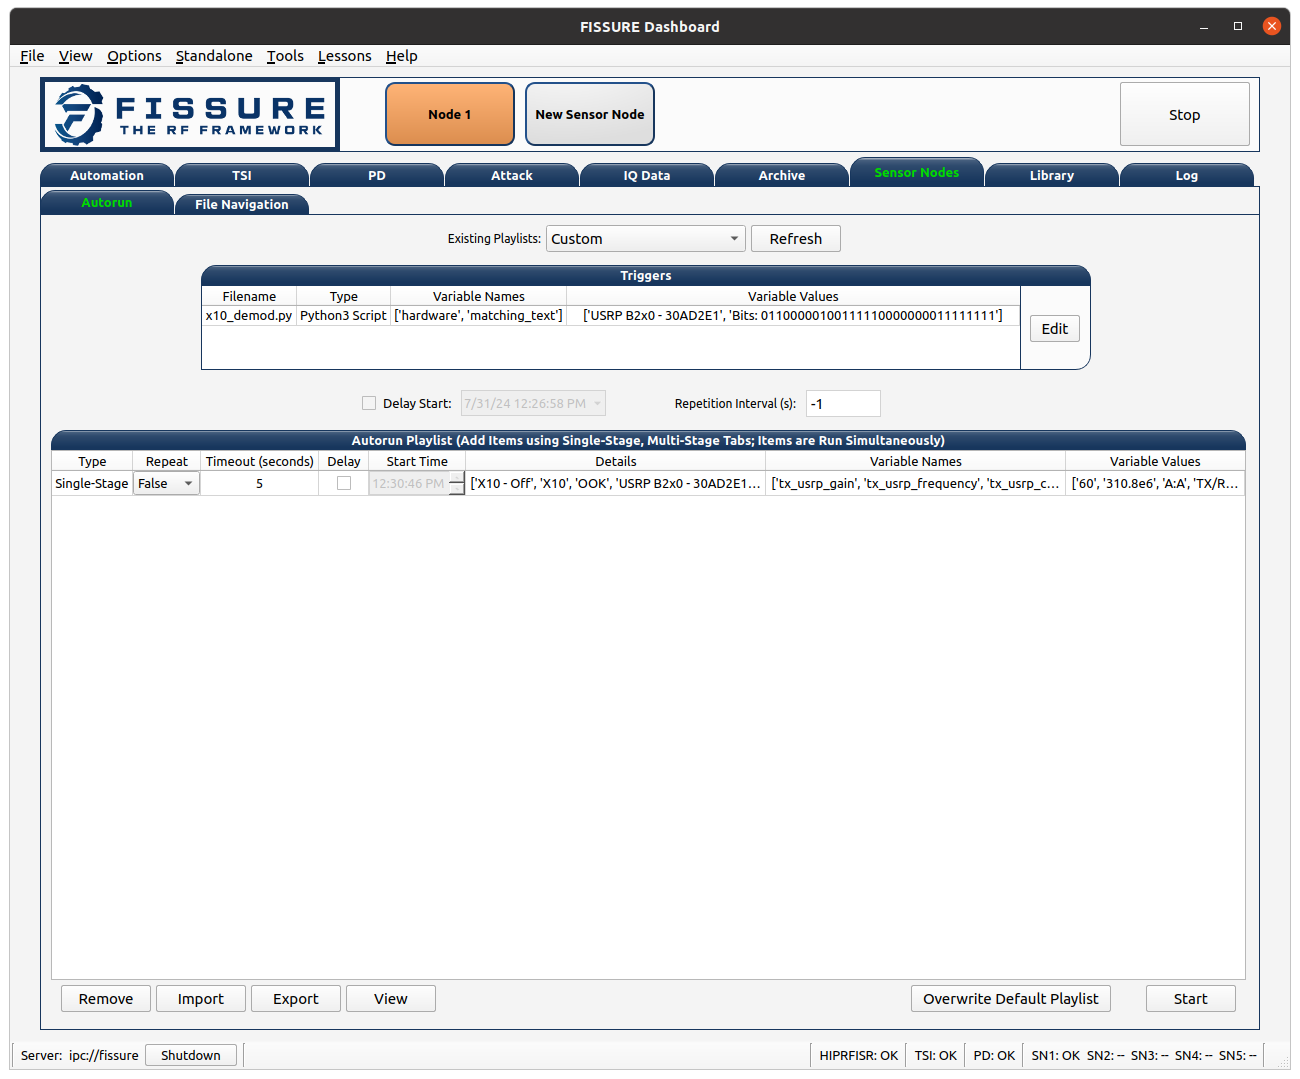
Autorun
Description
The Autorun tab is used to build, view, transfer, and initiate autorun playlists on the actively selected sensor node. The autorun feature consists of executing a playlist comprised of single-stage and multi-stage attack scripts. Each item is run simultaneously in their own thread to take advantage of more than one radio peripheral connected to the sensor node at a time. The sensor node has the option to run these playlists without interaction from the FISSURE Dashboard if the “autorun” field is set in the sensor node configuration default.yaml file.
Adding, Removing, Viewing Items
Playlist items can be added through the Single-Stage and Multi-Stage attack tabs. For Single-Stage attacks, load the attack by double-clicking the Attack Template and fill out the variable values for the attack. Click the “Add to Autorun” button to copy the attack details over to the playlist table. For Multi-Stage attacks, add the attacks and click “Generate” as normal. Click the “Add to Autorun” button to copy the multi-stage attack details over to the playlist table.
To remove a playlist item, select a row and click the “Remove” button. To view a playlist item as a single-stage or multi-stage attack, click the “View” button. Attack details cannot be edited in the playlist table.
Configuration
Playlists can have a delayed start time and date. Clicking the “Delay Start” checkbox will enable the feature. The playlist will execute immediately if unchecked. Each playlist item can have its own delayed start time if the “Delay” checkbox is checked. The value is ignored if unchecked. The timeout option for an item is used to stop the thread after so many seconds. Playlist items can finish before the timeout value depending on the nature of the script. Item threads will not repeat themselves unless the repeat option is set. A negative timeout value will cause an item to run indefinitely. The “Start” button will execute the contents of the table. Clicking the “Stop” button will end the playlist on the sensor node.
Import & Export
The “Export” and “Import” buttons are used to save and load playlists. The export feature allows the user to save a playlist to a YAML file. This file can copied directly to a sensor node to replace the /Autorun_Playlists/default.yaml file used for the autorun feature. The import feature will populate the playlist table from an exported YAML file. The “Existing Playlists” combobox is used to recall local playlists saved on the Dashboard computer in the /Sensor Nodes/Autorun_Playlists/ folder.
Overwriting Default Playlist
The “Overwrite Default Playlist” button will transfer the contents of the table and overwrite the /Autorun_Playlists/default.yaml file located on the sensor node.
File Navigation
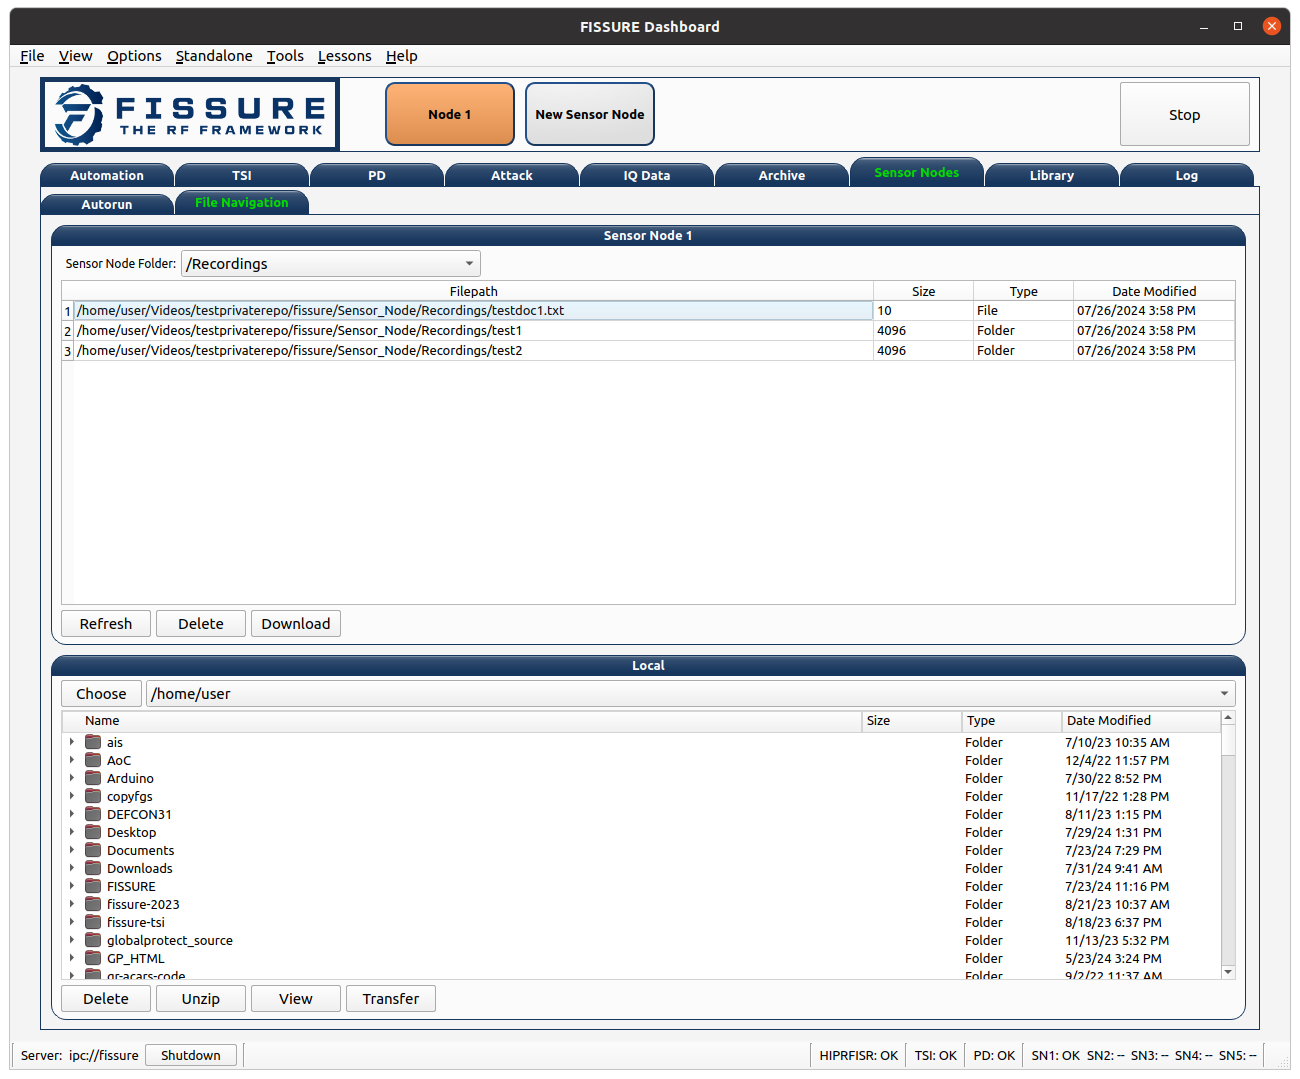
Sensor Node
The “Sensor Node” frame displays file information inside folders on the the actively selected sensor node. The user can delete files or folders and download them to the Dashboard computer. Folders are compressed into a .zip file prior to the transfer.
Local
The “Local” frame is used to select where downloaded files will saved. The folder used for downloading is the value in the combobox and not a folder selected in the tree. Selected files in the tree can be deleted and unzipped. Certain file extensions such as .txt can be opened using the view button. Custom viewing capabilities will be added for more file extensions to do operations like signal plotting. Small files can be transferred over the network and saved to the currently selected sensor node folder in the combobox. Large files are not supported at this time.
Library Tab
Browse
Choose FISSURE YAML file
Look at the contents
Gallery
Select protocol
Click through pictures
Search Library
Enter information for signals of interest (SOIs)
Enter data values for messages in library
Choose the checkboxes to use during search
Search Library
Remove
Select Protocol
Choose types to remove from library
Click associated Remove button
Add
Create new protocol
Add modulation type, packet type, signal of interest, statistics, demodulation flow graph, and attacks to existing protocol
Log Tab
System Log
Filter messages to view from log, click Refresh
Session Notes
Make notes and save attack history, system log, and session notes
Status Bar
Triggers
Configuration
Triggers are scripts that loop indefinitely until a condition is statisfied and are used to delay the start of transmission of electromagnetic effects for single-stage attacks, multi-stage attacks, archive replay, and autorun playlists. In each of those tabs a “Triggers” section can be found as shown below for the Single-Stage attack tab.
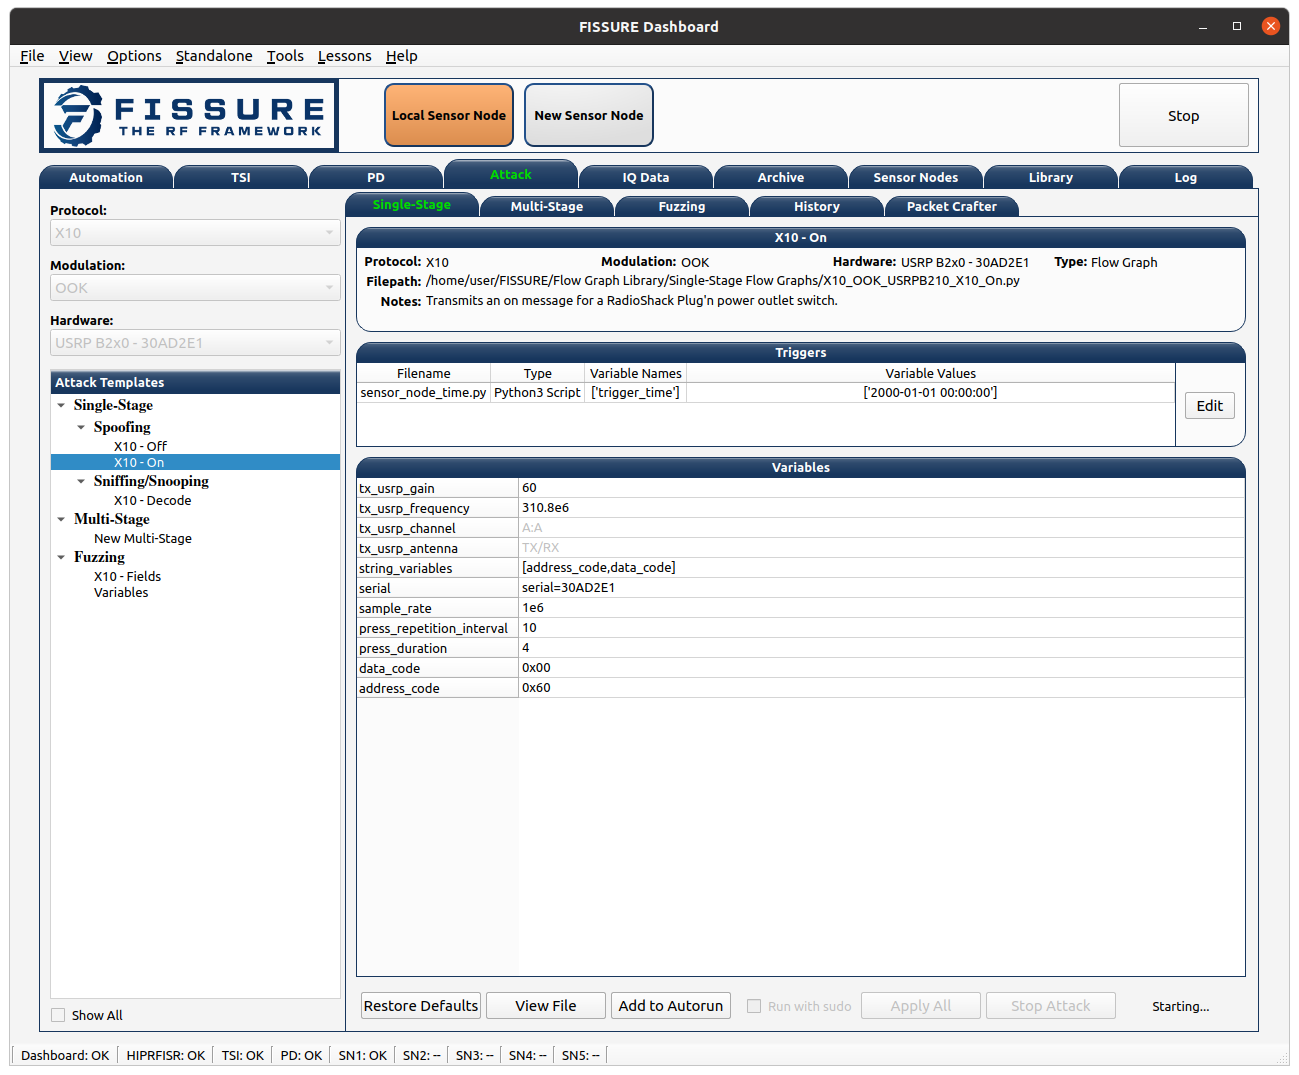
Clicking the “Edit” button will open the following dialog for selecting and configuring triggers.
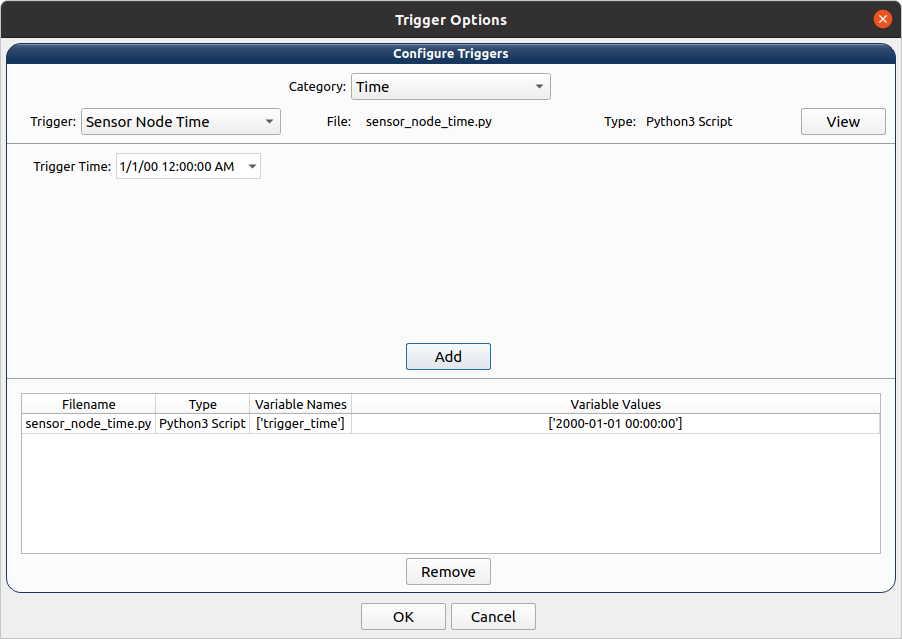
Choose the category and trigger from the comboboxes. Enter values into the user interface widgets specific to the trigger. Click “Add” to select a trigger. Multiple triggers can be selected and will be run simultaneously. Once the first trigger is complete, the remaining triggers will end and the subsequent action will be executed. Select a trigger from the table and click “Remove” to delete it. Click “OK” to save the triggers.
Trigger List
The following is a list of triggers integrated into FISSURE. To create new triggers refer to Creating Triggers.
Category |
Trigger Name |
Script Name |
Hardware/Requirements |
Description |
|---|---|---|---|---|
Acoustic |
Sound Threshold |
sound_threshold.py |
Microphone |
Activates once a custom audio threshold is reached on the active computer microphone |
Environmental |
Sunrise/Sunset |
sunrise_sunset.py |
Internet Connection |
Checks for sunrise and sunset time using “%S” and “%s” returns from wttr.in |
Environmental |
Temperature |
temperature.py |
Internet Connection |
Compares the temperature in a location to a value using wttr.in |
Environmental |
Weather |
weather.py |
Internet Connection |
Checks for rain, snow/sleet, clear, cloudy/fog in a city using keywords found in the “%C” returns from wttr.in |
Environmental |
Wind |
wind.py |
Internet Connection |
Checks for wind speeds above a threshold using “%w” returns from wttr.in |
Filesystem |
File Modified |
file_modified.py |
None |
Waits for a file to be modified |
Filesystem |
Folder Modified |
folder_modified.py |
None |
Waits for a folder to change the number of files it contains |
Networking |
Webserver Curl |
webserver_curl.py |
Network Connection |
Creates a local webserver that listens for a curl http://<ip_address>:<port> command to exit |
RF |
Cellular Tower |
cellular_tower.py |
RTL2832U |
Continuously runs “CellSearch” at a specific frequency to find a matching PCI/cell ID for a site |
RF |
Detect SSID |
detect_ssid.py |
WLAN Interface (Managed Mode) |
Looks for a matching SSID name using iwlist for a provided interface |
RF |
GPS Line |
gps_line.py |
GPS Receiver |
Checks if current GPS coordinates have crossed either a latitude or longitude threshold (N-S/E-W line) |
RF |
GPS Point |
gps_point.py |
GPS Receiver |
Checks current GPS coordinates until they are a specified distance from a point |
RF |
Plane Spotting |
plane_spotting.py |
RTL2832U |
Looks for an ICAO in dump1090 stdout from an RTL dongle |
RF |
Power Threshold |
power_threshold.py |
USRP B2x0 |
Looks for a signal above a power threshold at a specified frequency. Reuses the TSI fixed detector flow graphs without the GUI. |
RF |
RDS Keyword |
rds_keyword.py |
USRP B2x0 |
Looks for a keyword in the RDS printed from gr-rds for a radio station |
RF |
X10 Demod |
x10_demod.py |
USRP B2x0 |
Demodulates X10 signals for a USRP B210 and checks the flow graph stdout for matching text |
Time |
Sensor Node Time |
sensor_node_time.py |
None |
Waits for date/time to elapse |
Time |
Timer |
timer.py |
None |
Waits for N seconds after trigger script start |
Visual |
Motion Detector |
motion_detector.py |
Camera |
Checks for motion using the default camera |
Attack List
The following is a list of attacks in the FISSURE library and displayed in the Attack tab. Attacks are hardware dependent and may not be present for all hardware types. The developers welcome new scripts/flow graphs for converting existing attacks to the missing hardware types.
Attack Name |
Description |
|---|---|
802.11x - ARP Poisoning |
Generates Scapy ARP messages that continuously cycle through the last octet of the source IP address. |
802.11x - Beacon Flood |
Generates Scapy beacons with unqiue MAC addresses that increase sequentially. |
802.11x - Beacon Frame |
Generates the same Scapy beacon continuously. |
802.11x - CTS Frame |
Generates Scapy CTS frames. |
802.11x - DIR-815 Exploit |
While in monitor mode, injects a command via SSDP to a vulnerable UPnP device. Same as “UDP to AP QoS” in Packet Crafter. |
802.11x - Deauthentication Frame |
Generates Scapy deauthentication frames with reason=7. |
802.11x - ICMP |
Generates a Scapy ICMP packet and transmits it periodically. |
802.11x - LAND |
Transmits a Scapy TCP SYN spoofed packet where the source and destination IPs and ports are identical. This can cause the target to repeatedly send replies to itself and possibly lead to a crash. (Local Area Network Denial) |
802.11x - Probe Request Frame |
Transmits a Scapy probe request on repeat. |
802.11x - Relay |
Relays Wifi signals from one frequency to another. |
802.11x - SYN Flood |
Transmits Scapy TCP SYN messages with random source IP addresses to consume resources on the target. |
802.11x - Smurf |
Transmits Scapy ICMP request messages to all network hosts to make their responses overwhelm the target server. |
802.11x - TP-Link Archer A7 Exploit |
While joined to the network, executes a command placed in a file on the device using a UDP exploit. Use quotes with spaces. Single-use, requires reboot. |
802.11x - TP-Link Archer A7 Reboot |
While joined to the network, executes a reboot command on the device using a single UDP message. |
802.11x - UDP Hole Punch Server |
Responds to UDP messages containing the magic string. Observe the responses in Wireshark to map IP addresses and ports. See wifi_tx UDP Mapper. |
802.11x - UDP Replay PCAP |
Replays the UDP from a .pcap file with udpreplay while connected to a network. |
802.11x - wifi_tx ARP Poisoning |
Generates ARP messages that continuously cycle through the last octet of the source IP address. Messages are placed in UDP data and sent to a wifi_tx.py UDP port. |
802.11x - wifi_tx Beacon |
Generates Beacon frames with a custom SSID and MAC address. Beacon data is sent to the wifi_tx.py UDP port which needs to be connected to the mac_in of the WiFi PHY Hier block. |
802.11x - wifi_tx ICMP |
Generates ICMP messages. Messages are placed in UDP data and sent to a wifi_tx.py UDP port. |
802.11x - wifi_tx LAND |
Transmits a TCP SYN spoofed packet where the source and destination IPs and ports are identical. This can cause the target to repeatedly send replies to itself and possibly lead to a crash. Messages are placed in UDP data and sent to a wifi_tx.py UDP port. |
802.11x - wifi_tx SYN Flood |
Generates TCP SYN messages with random source IP addresses to consume resources on the target. Messages are placed in UDP data and sent to a wifi_tx.py UDP port. |
802.11x - wifi_tx Smurf |
Transmits Scapy ICMP request messages to all network hosts to make their responses overwhelm the target server. |
802.11x - wifi_tx UDP ARP Poisoning |
Generates UDP messages with different source addresses to fill up the target ARP table. Messages are placed in UDP data and sent to a wifi_tx.py UDP port. |
802.11x - wifi_tx UDP Crafter |
Generates UDP messages. Messages are placed in UDP data and sent to a wifi_tx.py UDP port. |
802.11x - wifi_tx UDP Crafter QoS |
Generates UDP messages. Messages are placed in UDP data and sent to a wifi_tx.py UDP port. |
802.11x - wifi_tx UDP File |
Reads in bytes of data and puts it in a UDP payload. Messages are placed in UDP data and sent to a wifi_tx.py UDP port. |
802.11x - wifi_tx UDP Mapper |
Transmits LLC/SNAP/IP/UDP data to wifi_tx with the server as the source to map a network for IP addresses and ports. |
802.11x - wifi_tx UDP PCAP |
Reads in a .pcap file, not .pcapng, and transmits UDP data line by line to a wifi_tx port with altered UDP addresses. |
Bluetooth Classic - btrx |
Executes the btrx command for monitoring Bluetooth at a specified frequency and sample rate. |
Bluetooth Low Energy - ble_dump |
Runs ble_dump.py and creates a pipe to Wireshark for dumping BLE packets. |
Bluetooth Low Energy - btrx |
Executes the btrx command for monitoring Bluetooth at a specified frequency, gain, and sample rate. |
Clapper Plus - Transmit |
Generates a signal that is similar to one of two buttons on a Clapper Plus remote control. |
DECT - Audio Sink |
Plays DECT audio using gr-dect2 blocks. |
DECT - CW |
Jams DECT with a CW signal. |
DECT - File Sink |
Records a DECT payload to a file. |
DECT - File Sink IQ |
Records DECT IQ signals captured through a power squelch to a file. |
DECT - From File |
Modulates a previously-recorded DECT packet. |
DECT - Gaussian |
Jams DECT with a Gaussian noise source. |
DECT - Simple Replay |
Relays a DECT signal to another frequency. |
DECT - Wireshark |
Captures DECT signals and pipes the messages to Wireshark. |
DSRC - From File |
Sends raw binary data to wifi_tx UDP port. |
DSRC - wifi_tx Generator |
Generates DSRC messages using a coordinate file and a key file. Messages are sent to a wifi_tx UDP port. |
Ethernet - DIR-815 Exploit |
While in monitor mode, injects a command via SSDP to a vulnerable UPnP device. Same as “UDP to AP QoS” in Packet Crafter. |
Ethernet - MAC Flooding |
Floods the local network with random MAC addresses causing some switches to fail and potentially facilitate hub style sniffing. |
Ethernet - TP-Link Archer A7 Exploit |
While joined to the network, executes a command placed in a file on the device using a UDP exploit. Use quotes with spaces. Single-use, requires reboot. |
FM Radio - Audio Sink |
Plays FM radio audio. |
FM Radio - CW |
Jams FM radio stations with a CW signal. |
FM Radio - File Sink |
Records a set amount of FM data to a file while playing the audio. |
FM Radio - From File |
Transmits FM data from a file on a loop. |
FM Radio - From Wav File |
Converts a .wav file to an FM signal. |
FM Radio - Gaussian |
Jams FM with a Gaussian noise source. |
FM Radio - Simple Replay |
Relays filtered FM signals to another frequency. |
Garage Door - Cycle |
Cycles through DIP switch combinations sequentially. |
Garage Door - Transmit |
Simulates a remote control button press for one DIP switch value. |
General - IQ Playback Repeat |
Replays an IQ file on repeat. |
General - IQ Playback Single |
Replays an IQ file once. |
General - IQ Record |
Records an IQ file for a specified number of samples. |
General - IQ Record Squelch |
Records an IQ file for a specified number of samples following a power squelch. |
General - Instantaneous Frequency |
Test attack for flow graphs with GUIs. |
General - OOK Transmit |
Generates custom on-off keying signals with repeating bursts at regular intervals. |
General - Sleep |
Sleeps for a duration. |
HD Radio - Naughty String Injection |
Inject naughty strings into the artist or song title in HD Radio from a JSON file. Specify ‘title’ or ‘artist’ to direct the injection process. |
Mode S - Dump1090 Interactive |
Runs dump1090 in interactive mode. Go to: http://127.0.0.1:8081 |
Mode S - Dump1090 Raw File |
Executes the “./dump1090 –raw > ascii_file.txt” command to save ASCII data (*8dc051daf82300020049b8c711c4) to a file. |
Mode S - Dump1090 Raw Network |
Executes the “./dump1090 –raw | nc 127.0.0.1 55555” command to transfer ASCII data (*8dc051daf82300020049b8c711c4) over a network. |
Mode S - Fields |
Flow graph for fuzzing fields in Mode S messages at a regular interval. |
Mode S - From File |
Transmits ADSB binary data supplied from a file. |
Mode S - dump978 uat2text |
Executes the “rtl_sdr -d 0 -f 978000000 -s 2083334 -g 48 - | ./dump978 | ./uat2text” command to decode 978 MHz UAT messages into a readable format. |
Mode S - gr-adsb Brief |
Prints formatted decoded ADSB data (gr-adsb) originating from an SDR (2 MS/s) to stdout with the brief option selected. |
Mode S - gr-adsb To Webserver |
Forwards formatted decoded ADSB data (gr-adsb) originating from an SDR (2 MS/s) to a webserver (tcp://127.0.0.1:5001) over ZMQ. |
Mode S - gr-adsb Verbose |
Prints formatted decoded ADSB data (gr-adsb) originating from an SDR (2 MS/s) to stdout with the verbose option selected. |
Mode S - gr-adsb Webserver |
Forwards formatted decoded ADSB data (gr-adsb) originating from an IQ file to a webserver (tcp://127.0.0.1:5001) over ZMQ. |
Morse Code - File |
Generates Morse Code for one user-provided message and writes the IQ samples to file. The audio will stop when the message is complete. |
Morse Code - Transmit |
Generates Morse Code for one user-provided message and transmits the signal. The audio will stop when the message done transmitting. |
RDS - Fields |
Flow graph for fuzzing fields in RDS messages at a regular interval. |
RDS - File Source |
Replays RDS data on repeat supplied from a file. No audio is added. |
SimpliciTI - Access Point DoS |
Replays data that will create a denial of service at the access point. |
SimpliciTI - Add Node |
Replays data from an add node message. |
SimpliciTI - CW |
Jams SimpliciTI with a CW signal. |
SimpliciTI - Fields |
Flow graph for fuzzing SimpliciTI message fields at a regular interval. |
SimpliciTI - From File |
Replays message data supplied from a file. |
SimpliciTI - Gaussian |
Jams SimpliciTI with a Gaussian noise source. |
SimpliciTI - Unlink Node |
Replays an unlink node message supplied from a file. |
TPMS - Receive |
Decodes TPMS signals (only one format) and prints the output. |
TPMS - Transmit |
Transmits TPMS signals periodically. |
X10 - Decode |
Decodes X10 signals and prints the output. |
X10 - Fields |
Flow graph for fuzzing X10 message fields at a regular interval. |
X10 - Off |
Transmits an off message for a RadioShack Plug’n power outlet switch. |
X10 - On |
Transmits an on message for a RadioShack Plug’n power outlet switch. |
ZWAVE - Color List |
Cycles through a list of colors built into the message_generator_pdu block. Tested against a Monoprice Z-Wave Plus RGB Smart Bulb. |
ZWAVE - Off |
Transmits an off message for a Monoprice Z-Wave Plus RGB Smart Bulb. |
ZWAVE - On |
Transmits an on message for a Monoprice Z-Wave Plus RGB Smart Bulb. |
ZWAVE - Random Colors |
Randomly generates a new RGB value for each message. Tested against a Monoprice Z-Wave Plus RGB Smart Bulb. |
ZWAVE - Receive |
Decodes Z-Wave messages and prints the output. Tested against a Monoprice Z-Wave Plus RGB Smart Bulb. |
ZWAVE - Transmit |
Transmits a Z-Wave message (default is a red light). Tested against a Monoprice Z-Wave Plus RGB Smart Bulb. |